165754
In Canvas, you have options to track student activity via Course Analytics and Course Statistics. For more information on the Grades area in Canvas, see Canvas Grades and Grading FAQs.
Keep in mind: We do not recommend using Canvas analytics to determine attendance or participation grades.
Instead, Canvas analytics provides a general sense of how your students are interacting with your course materials. The analytics can give you a sense of which students you may need to reach out to if they appear not to be engaging with your course.
Course Statistics
Course Statistics provide basic information as to which specific course items are engaging students and which course items could be improved for future use to better encourage student engagement.
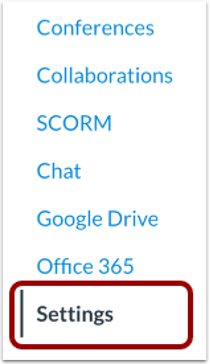
- From the left-hand Course site navigation menu, select Settings.
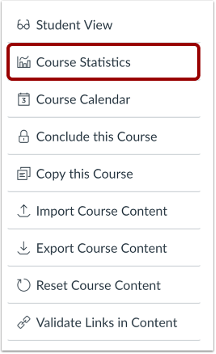
- From the right-hand Course settings navigation menu, select Course Analytics.
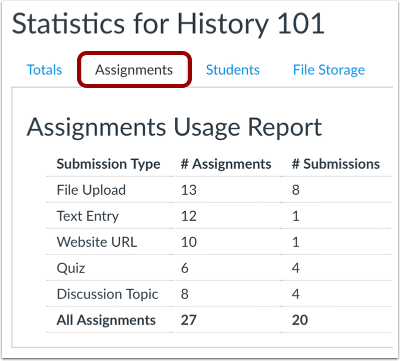
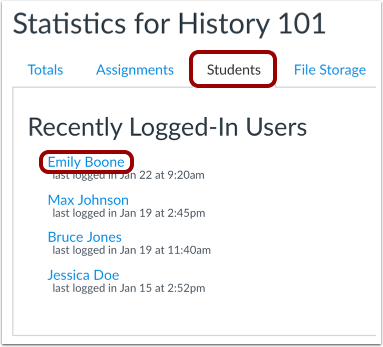
Viewing Totals and Storage
In the Course Statistics view, you can view running totals, assignments, students, and total file storage for your course.
- Please note that any files from a previous course import or course copy are not included in the storage quota or file counts. Learn more about course files.
Course Analytics
Course Analytics is a Canvas feature that provides information to instructors about how students perform in your course. Analytics are available for both active and concluded courses.
-
If you cannot view the Course Analytics link in Course Navigation, you may have to make the link visible via the Navigation tab in Course Settings.
-
The Course Analytics instructor dashboard includes multiple data tabs, each of which can be filtered to display more specific information:
-
Course grade: displays student course grades in grade graph or grade table formats, both of which have multiple filtering options.
-
Weekly online activity: provides information on Canvas page views and course participation in filterable activity graph or activity table formats.
-
Students: displays grade, participation, and communication analytics for individual students.
-
Reports: provides options to run and download reports of assignment completion rates, student contact information, or user interactions with course resources.
-
For instructors, the Course Analytics tool displays data about all students enrolled in the course. Student users who access Course Analytics can only view their own data.